Setup Dashboards with New Relic Insights
My team has a New Relic Insights dashboard up in our area on a large screen. As I was talking to someone, I noticed the error count jump from 10 to 20 to 40 and 80 in a manner of minutes. Something was not right. That is very abnormal. We shouldn't have more than five errors an error. 80 in that short of a timespan is bad. Soon enough our New Relic alerts started coming in through Slack and Email.
This dashboard is something new my team and I setup over the past couple of weeks with the help of Sean Speck. It was in response to a previous production outage. We didn't know about a problem until people started notifying us. We want to be proactive. In a previous article I discussed how Sean Speck and I set up alerts using New Relic. The goal of these alerts is to notify us of any problems. That is a big help, but we have to have the right alerts setup. Being able to see the overall health of the system at a glance would provide another way to be proactive.
Insights Introduction
New Relic Insights u NRQL, or New Relic Query Language. It is very common to SQL which makes it a snap to pick up. But New Relic add its twist to the language to make it very useful.
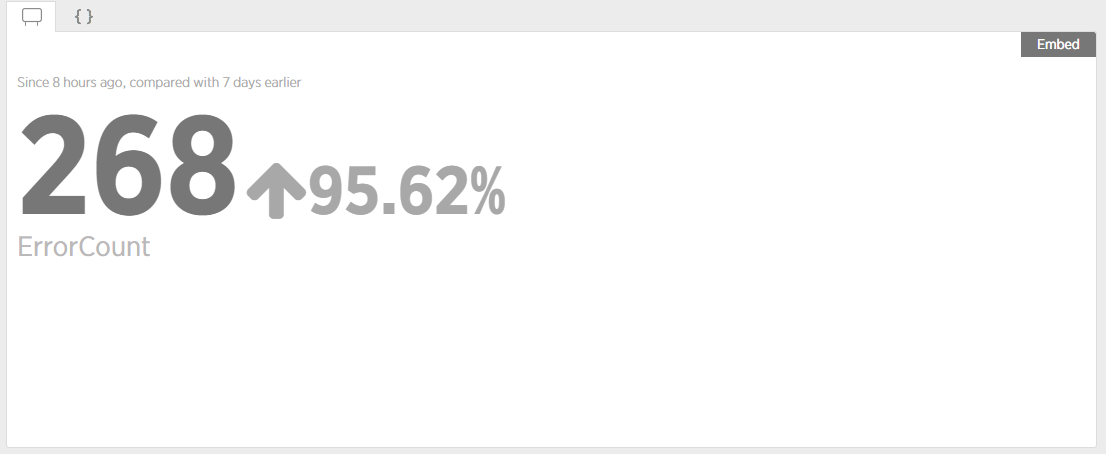
For example, if I wanted to get a count of all the errors for a particular application in the last eight hours compared with a week ago the query would look like this:
SELECT count(*) As ErrorCount from Transaction where appName = 'SomeAppName' and errorType is not null since 8 hours ago compare with seven days ago with TIMEZONE 'America/Chicago'
New Relic Insights can create different widgets depending on how you want to visualize the data.
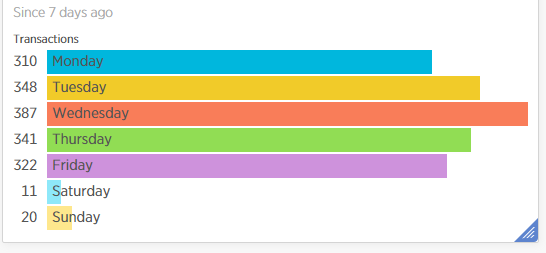
Bar charts
Area charts
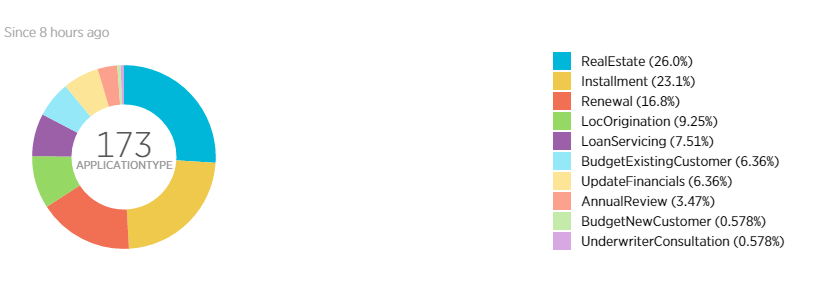
Pie charts
There are more. The excellent documentation shows all the widgets possible.
Those widgets can be added to a dashboard to provide an overview of the health of the application.
Insight Limitations
The out of the box functionality provides an excellent foundation. Going back to the error count example, the loan origination system where that error count was pulled from connects to 15 services. How many of those errors were caused by an error in one of those services? Today I saw the error count jump from 10 errors in the last 60 minutes to 20 then 40 then 80, and it kept climbing. Was that being caused by a problem in the loan origination system or was that being caused by an error in one of those many services? There is no way for New Relic to know that out of the box and report that accurately. Or to the degree of accuracy in which we require to troubleshoot properly.
Adding Custom Parameters Via New Relic NuGet Package
New Relic has created a NuGet package to extend out the data being captured and used by Insights. All it takes is one line of code to add a little bit of data to get more accurate information.
NewRelic.Api.Agent.NewRelic.AddCustomParameter("ApplicationRestCallError", "Error in calling Rest Rest Service");
Once that has been added the NRQL query can be slightly adjusted to look for errors which have the ApplicationRestCallError attribute.
SELECT count(ApplicationRestCallError) as ErrorCount from Transaction where appName = 'SomeApp' and ApplicationRestCallError is not null since 8 hours ago
During real world usage, we also found New Relic likes to capture every possible exception. For example, it captures "A Task Was Cancelled" exceptions. We make use of C#'s Asynchronous functionality. What happens is a user's browser makes a request and in while the request is being processed the user navigates away or closes the browser. The API wants to return that data, but there is nothing to return to, so an exception is thrown.
To get around this issue, we added a line of code to create custom parameter right before the error is logged.
public void LogError(string messageText)
{
    NewRelic.Api.Agent.NewRelic.AddCustomParameter("ApplicationError", "Error in application");

    LogMessage(messageText, 1);
}
The resulting NRQL is:
SELECT count(ApplicationError) as ErrorCount from Transaction where appName = 'SomeApp' and ApplicationError is not null since 8 hours ago
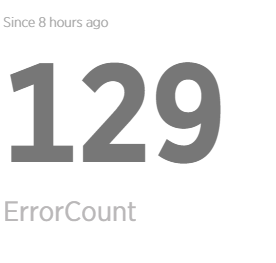
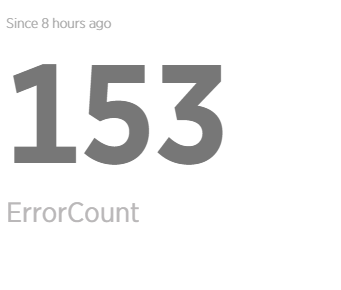
153 errors in the application in the last 8 hours, but 129 of them were caused by a problem with an external service. We can focus on fixing those 24 errors in our code and contact the team or teams responsible for the services throwing all the errors to see if they can fix them.
Adding Insights Attributes from JavaScript
The .NET NuGet package is fantastic. But the loan origination system is a Single Page Application (SPA). It would also be very handy to have the ability to log from JavaScript. Our desire was to track feature functionality.
The good news is when a page is sent from the server to the browser NewRelic injects a small JavaScript library which adds that ability. All that is needed is a little custom code to take advantage of that library.
Unlike the .NET NuGet package it the JavaScript logging requires more than one line of code. The .NET NuGet package is setup to handle the possibility of the .NET agent not being installed on the server. Also, it traces the whole transaction. With JavaScript, there could be multiple concurrent transactions. We also wanted the ability to capture the email address and partner of the user to make debugging a little easier. For this example, I wrote a custom Angular 1.x State Service to wrap all the required functionality.
(function () {
    angular
        .module('app')
        .service('newRelicStateService', newRelicStateService);

    newRelicStateService.$inject = ['UserInfo', 'PARTNER_ID'];

    function newRelicStateService(UserInfo, PARTNER_ID) {
        var stateService = {};

        stateService.logFeatureUsage = function(featureName, jsonData) {
            if (typeof newrelic === 'undefined' || newrelic === null) {
                return;
            }

            if (typeof jsonData === 'undefined' || jsonData === null) {
                jsonData = {};
            }

            // User Info is a custom JSON object our application creates
            jsonData.EmailAddress = UserInfo.EmailAddress;
            jsonData.PartnerName = PARTNER_ID;

            newrelic.addPageAction(featureName, jsonData);
        };

        return stateService;
    }
})();
To make use of this the only thing required is to reference that state service and call this function.
newRelicStateService.logFeatureUsage("NavigationCollapse", { collapseNavigation: !$scope.isNavigationCollapsed });
The NRQL changes slightly. It will query the PageAction table instead of querying the transaction table.
select count(*) from PageAction where appName = 'SomeAppName' and actionName = 'NavigationCollapse' facet EmailAddress since 12 hours ago
Important Note: You can only log 20 Page Actions every 10 seconds. After that limit is reached additional events are not captured.
Conclusion
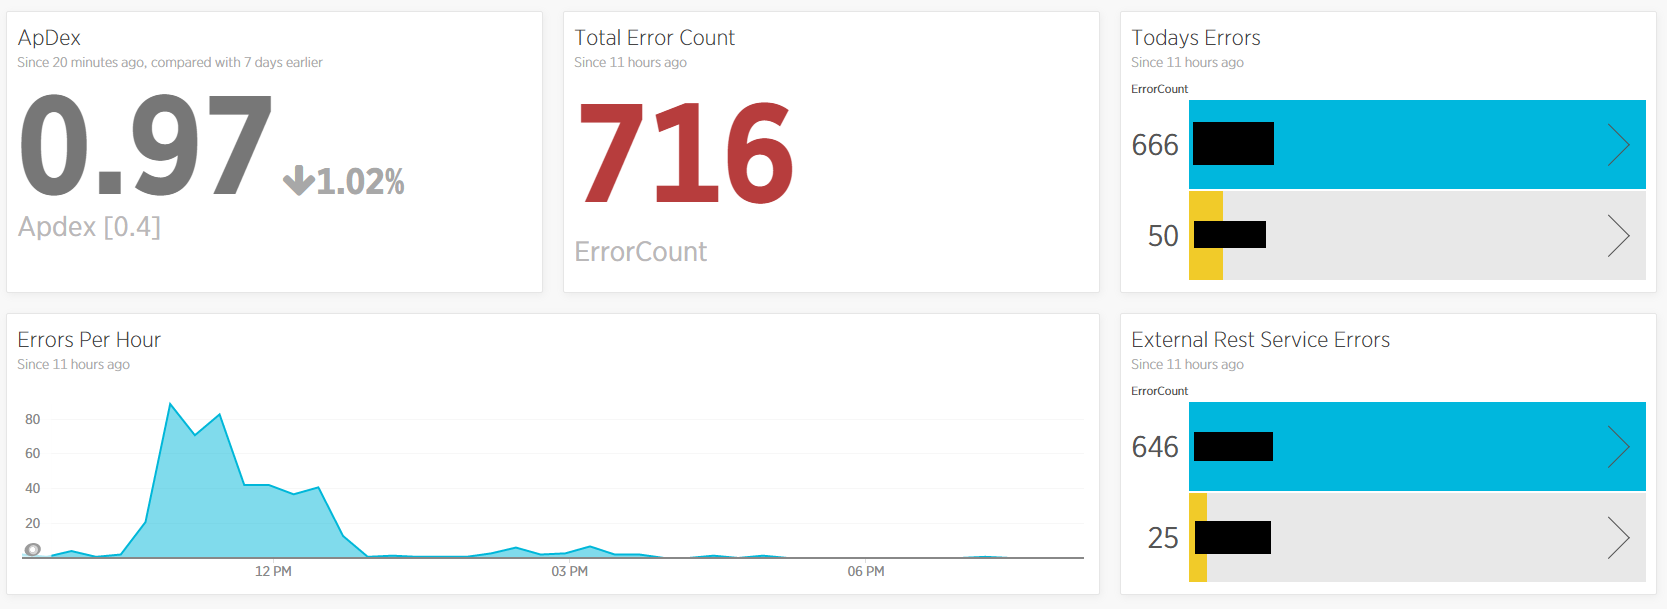
Back to the production issue, we saw at the start of this article. Our dashboard has several error reports, reports per hour, total errors in the last 60 minutes and total errors in the last 8 hours broken out by partner. For the example of this article, we are only going to use two partners; we will call them Blue and Orange.
We could clearly see almost all the errors were happening with partner Blue. That particular partner hosts their services, and through troubleshooting, we were able to determine there was an issue with one of their servers which required a reboot.
In the past, all errors only came through email. Email has a nasty habit of being ignored. We wouldn't know about the problem until our users started reporting it through tech support. With New Relic, my team and I have been able to set up alerts with multiple channels of delivery. Also, we can now see a visual of the errors as they came in.
With those two tools, today we started working on the solution almost an hour before users started notifying tech support of a problem.

